Forecast Whatif
Forecast Whatif
Overview
The Forecast Whatif tool allows you to run the Forecast Scenario for a specific cohort of service users and compare the two scenarios.
Process - Forecast Whatif
To forecast future demand for the two scenarios go to Forecast, Whatif.
At the top, choose the Cohort you wish to analyse [Or you can create a new cohort in Cohort Creator if it hasn't been created already]
Once you have selected a cohort, previously created scenarios for this cohort will appear as a list, or you can create a new scenario. Either select an exiting scenario, or choose to create a new one.

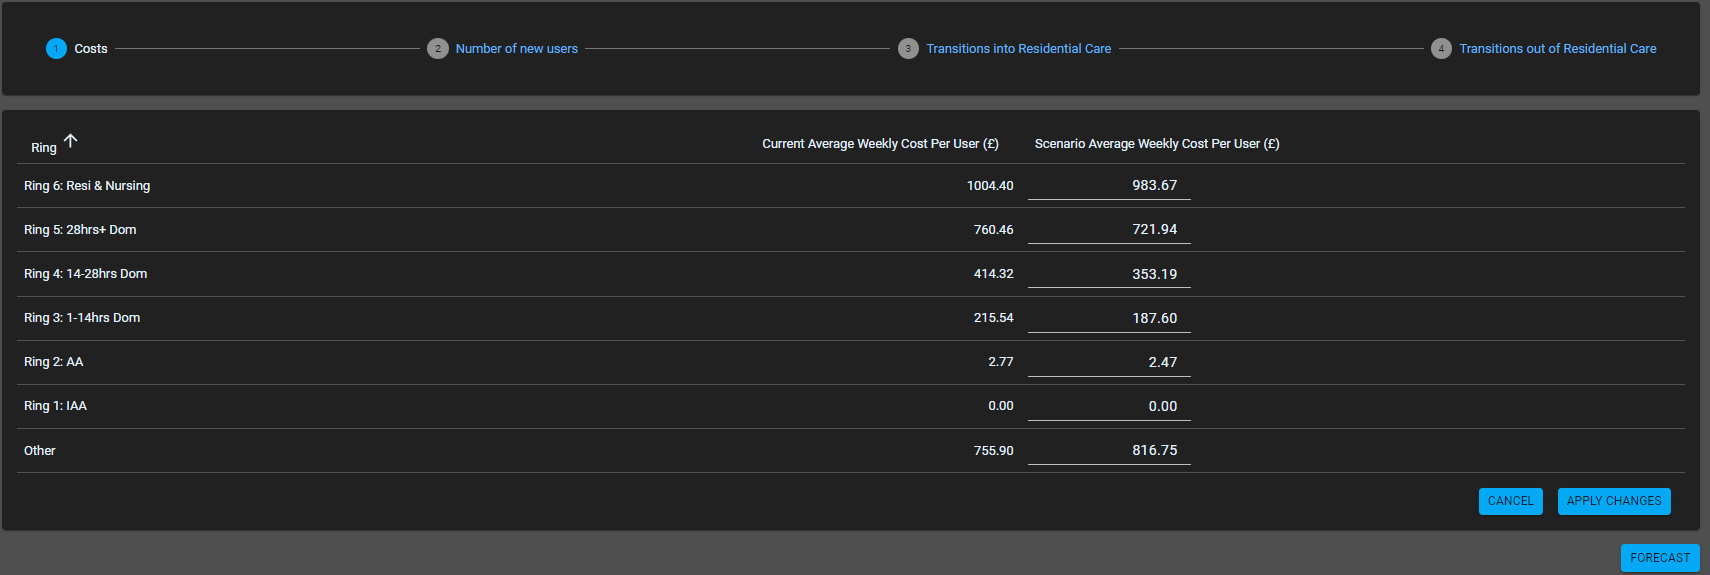
You will be presented with present day average ring costs. Input the future average costs of care for each Ring that you would like to use in the prediction. You could use the present day costs, or inflate/amend these as appropriate.
Choose "Apply changes"
The next screen allows you to amend the rate at which new users come onto the system. You will be presented with the existing number of new users per month and you can enter a scenario number to examine.
Choose "Apply Changes"

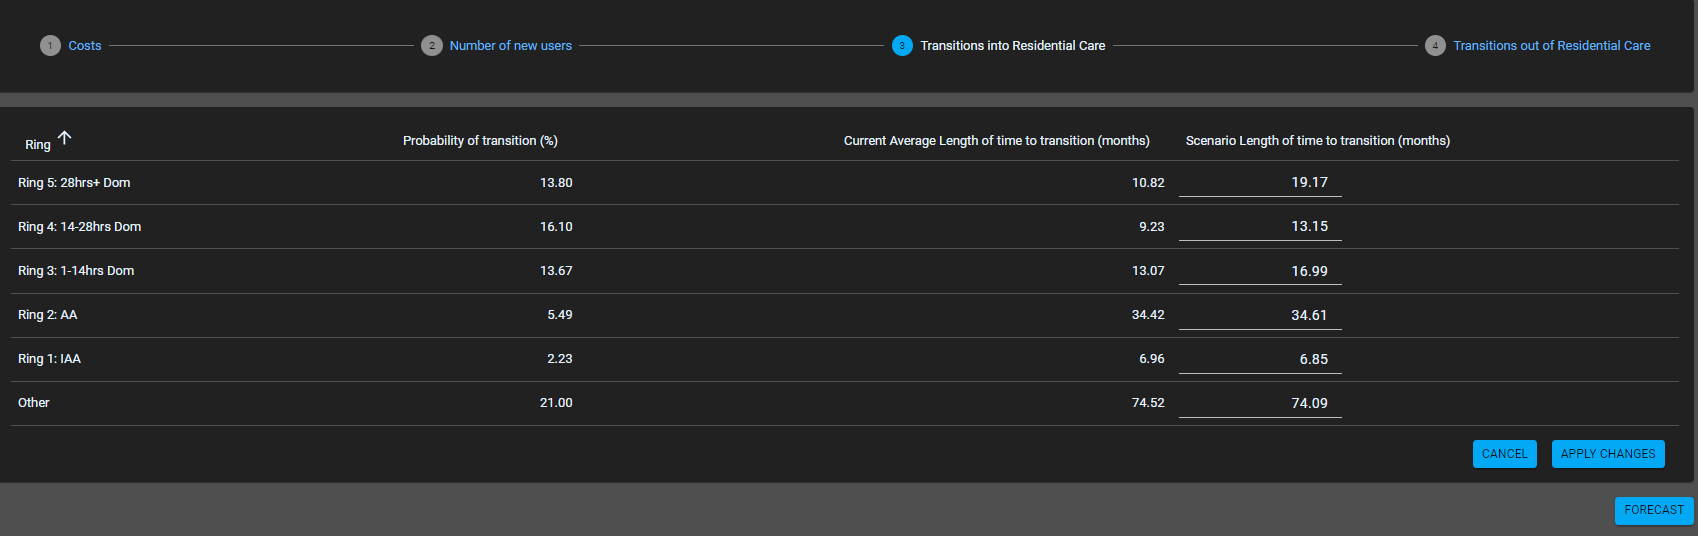
The next screen allows you to amend the rate at which people transition INTO residential care. For information, you will be presented with existing probability of transition into Residential Care from each of the other Rings. You are also presented with the number of months people people stay on lower rings before they transition to Ring 6 (residential care). You can enter a scenario number of months to examine. For example if you wanted to delay the rate at which dom care users transition to residential care you could increase the number of months for rings 3, 4 and 5.
Choose "Apply Changes"
The next screen allows you to amend the probability of users transitioning from residential care to another ring and also the rate at which they transition. It is presented as a probability of transition (where the total for all rings must add up to 100 - there is a total box at the top to help with this) and a number of months people are on ring 6 before they transition. You will be presented with the probability and number of months that people typically take and you can enter scenario values to examine.
Choose "Forecast"

As for the Forecast Costs tool, you will be presented with Tables for all users and each Ring with data for each primary measure for now and years 1-5 in the future under the chosen scenario.
You will also be presented with graphs of the primary measures.